Information Graphics
2022 - Editorial Design with Illustrations
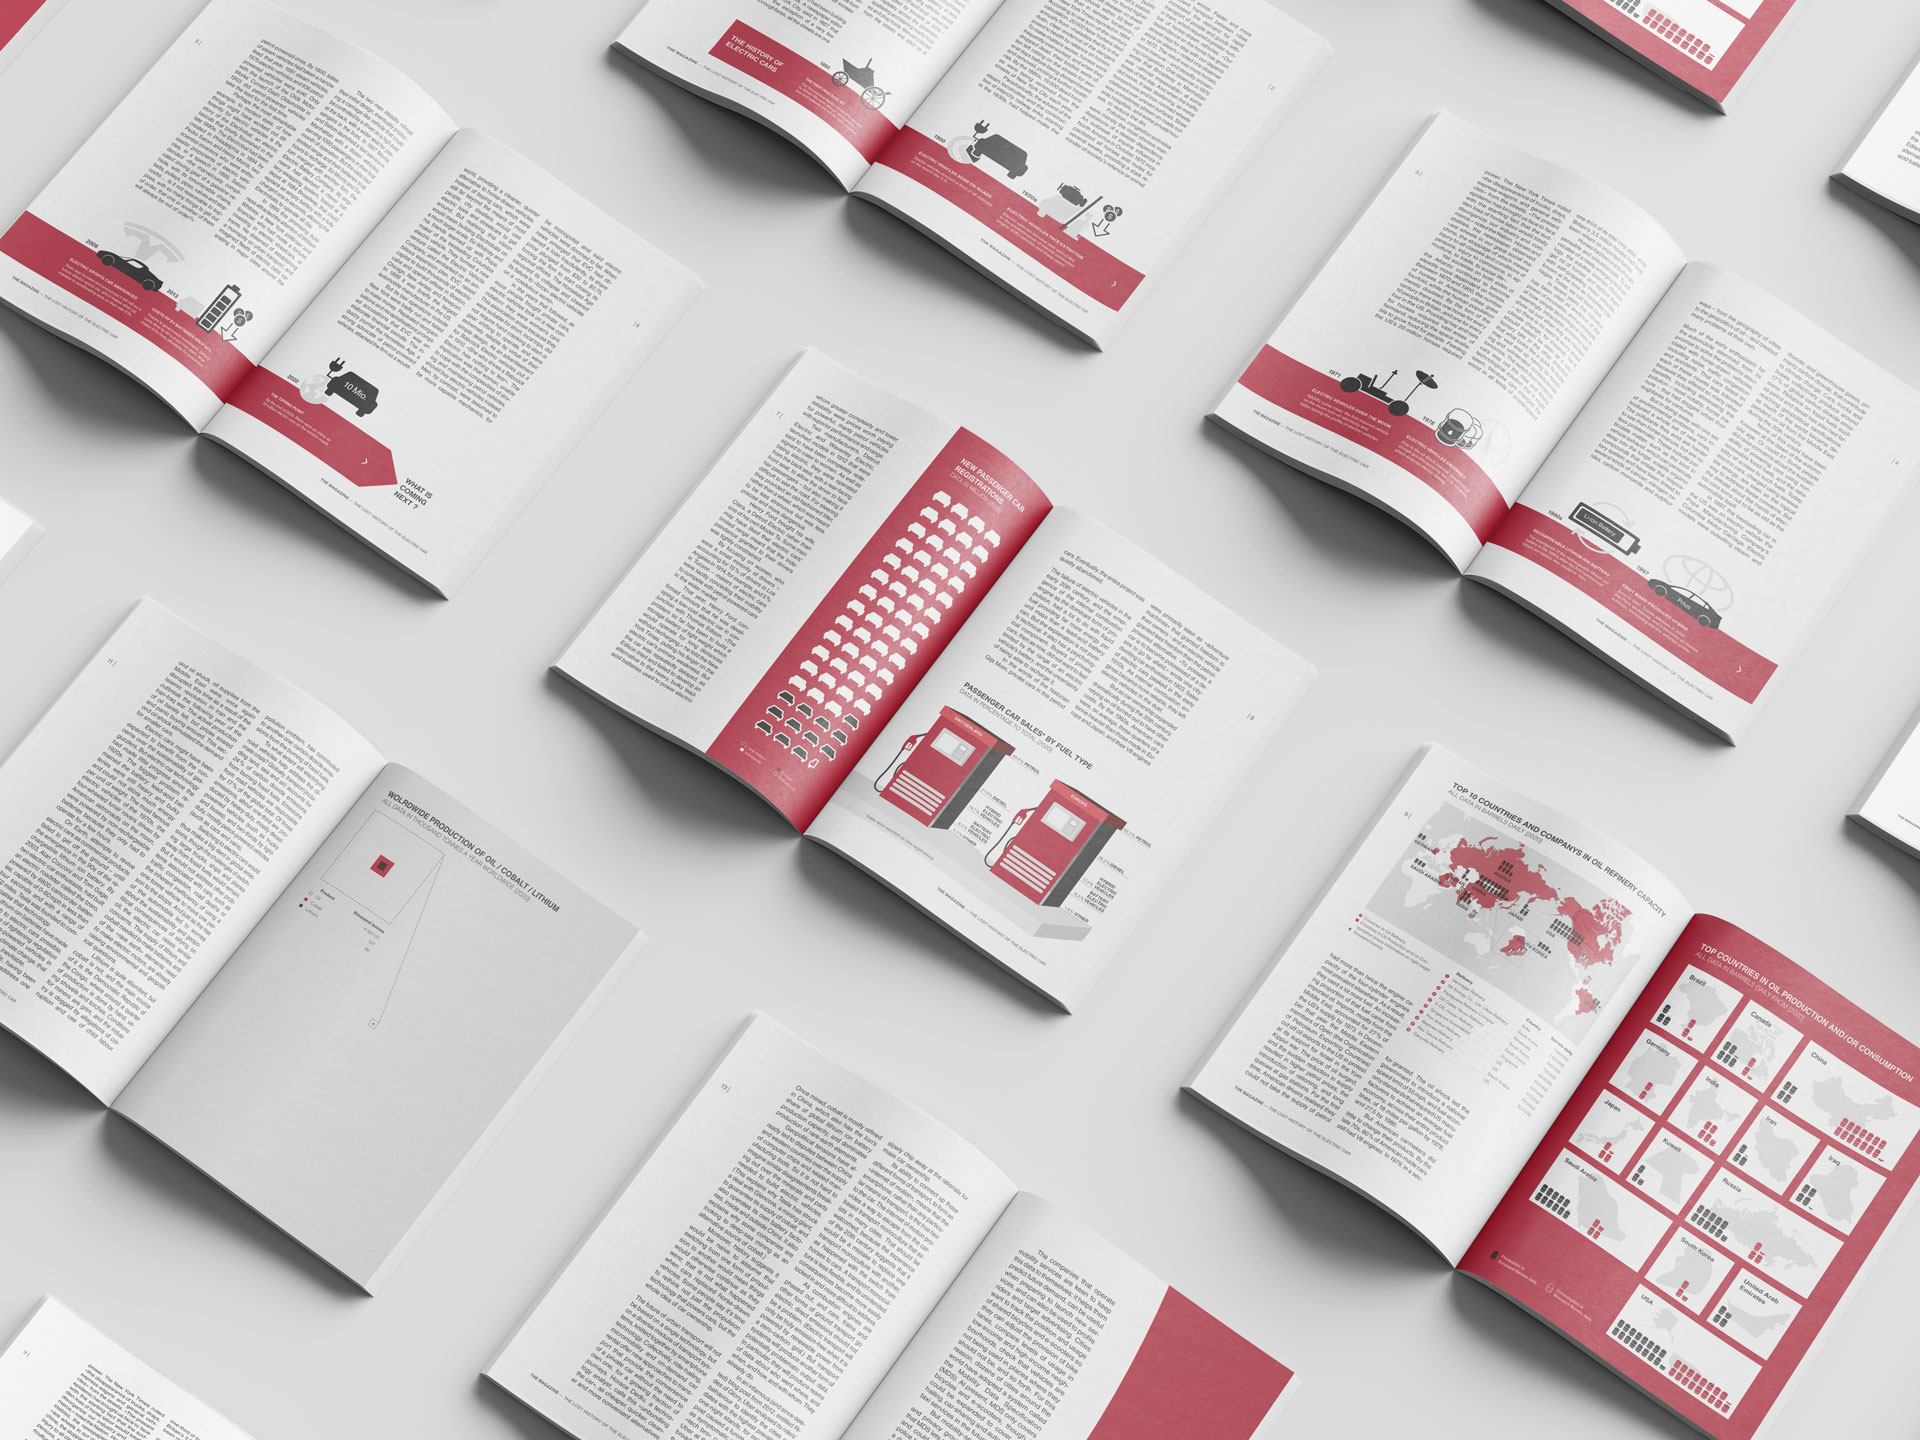
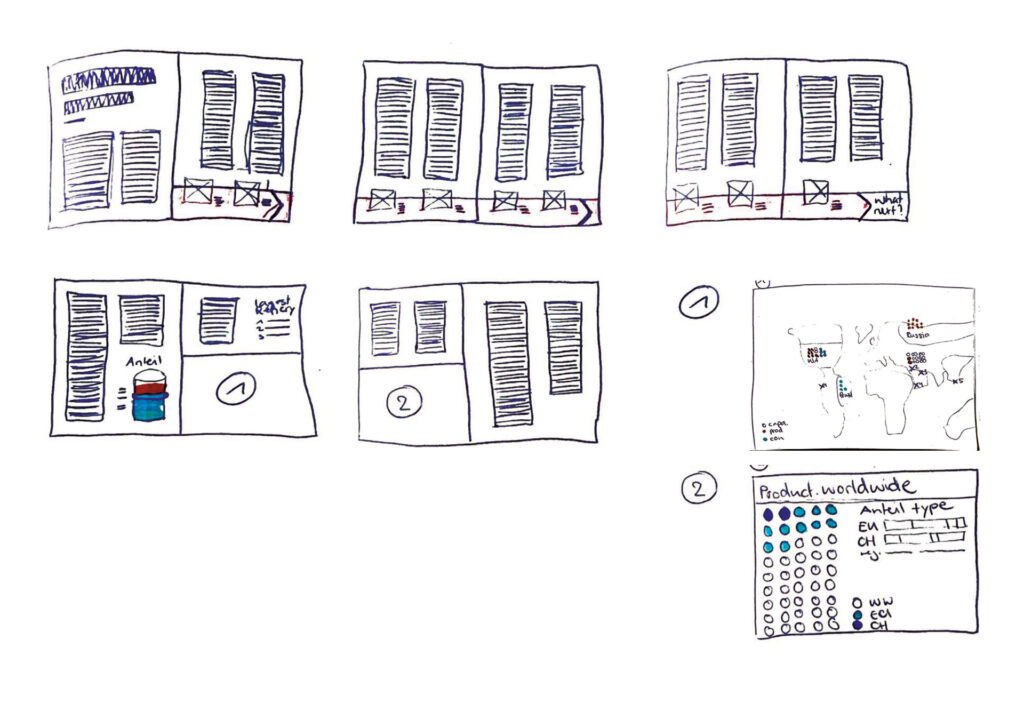
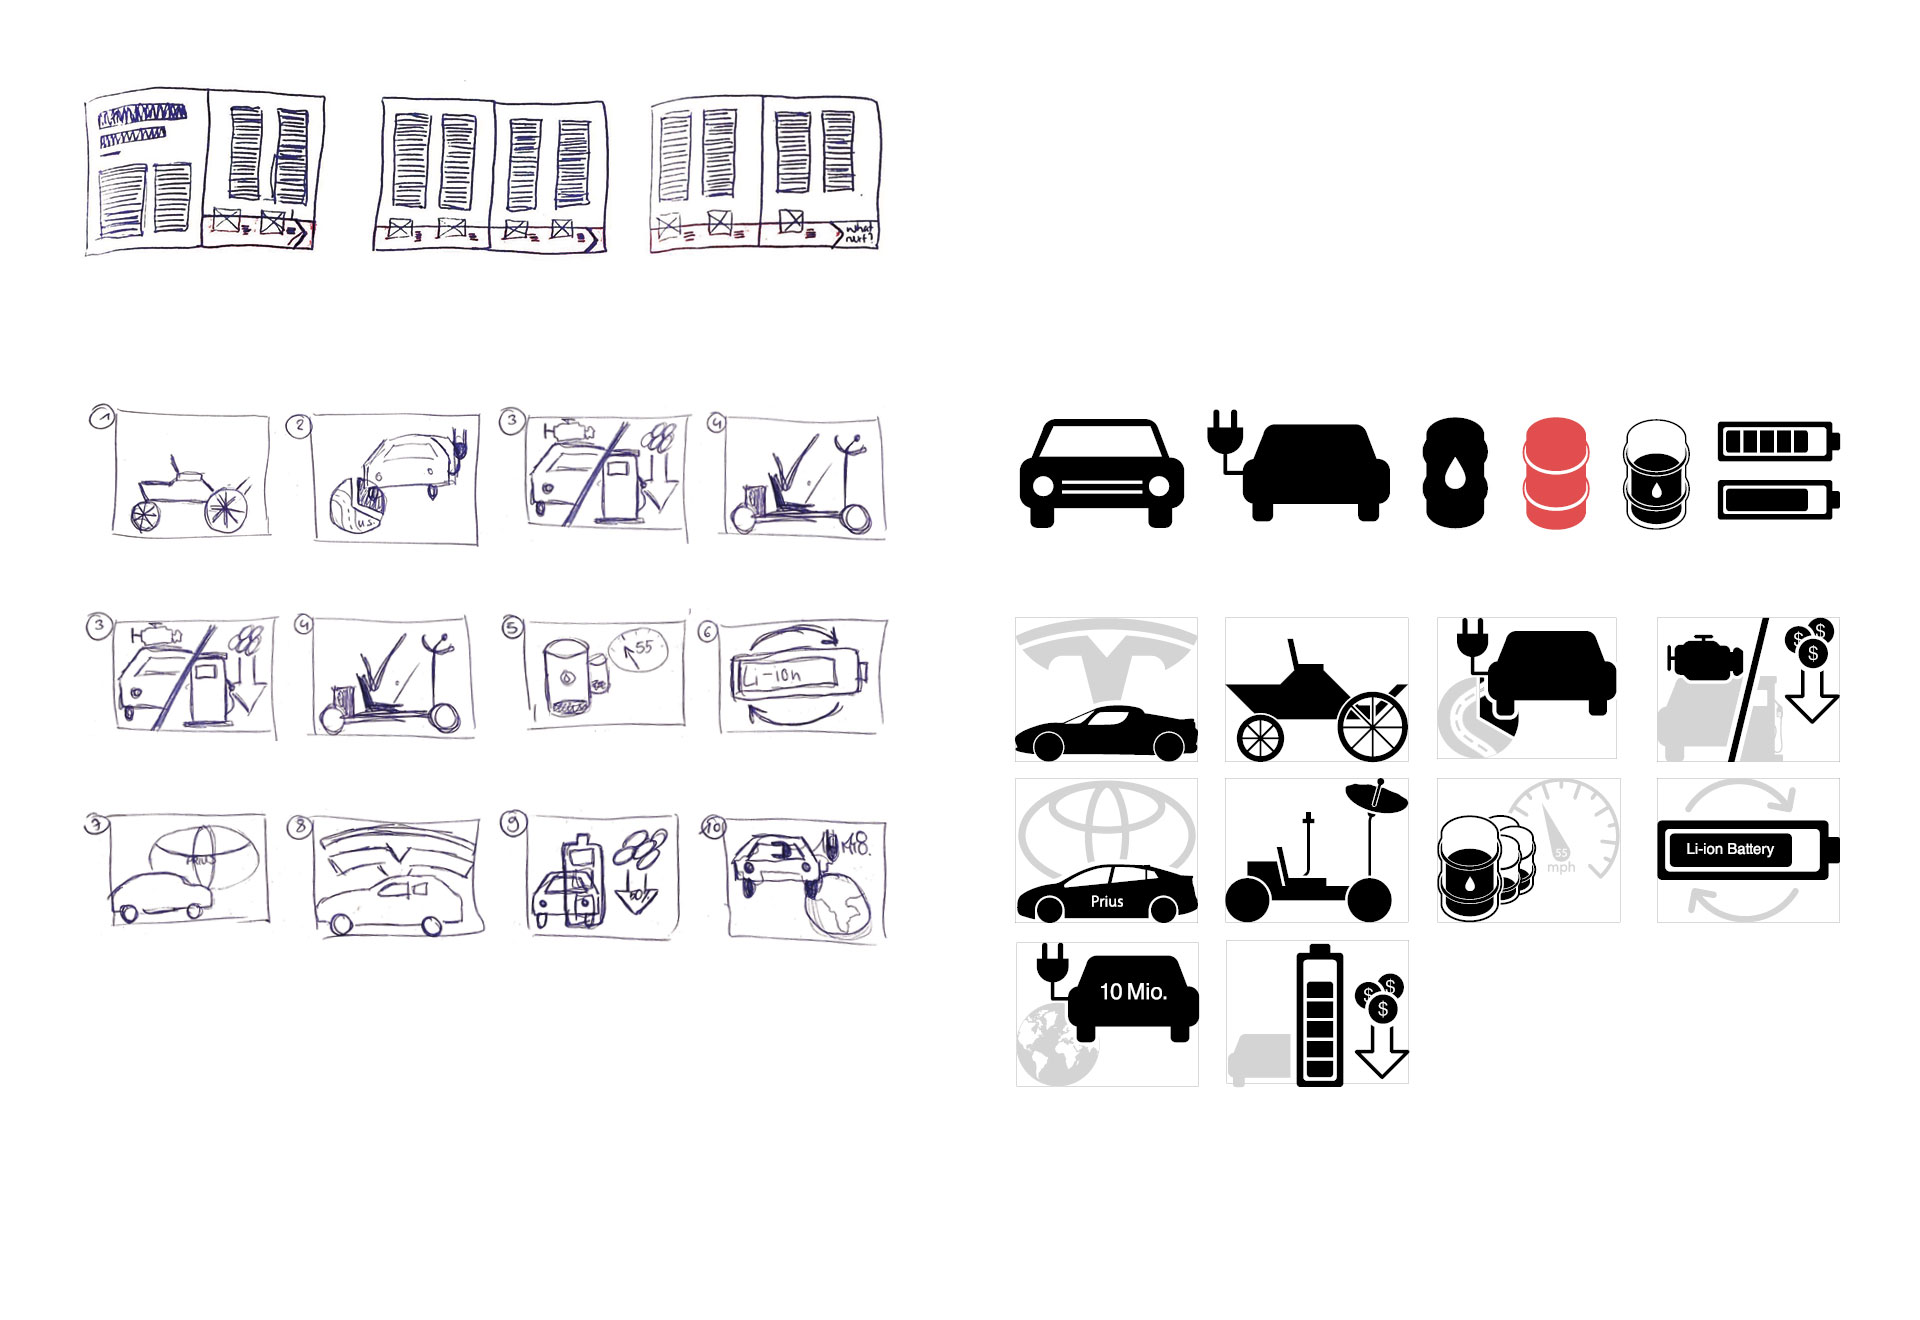
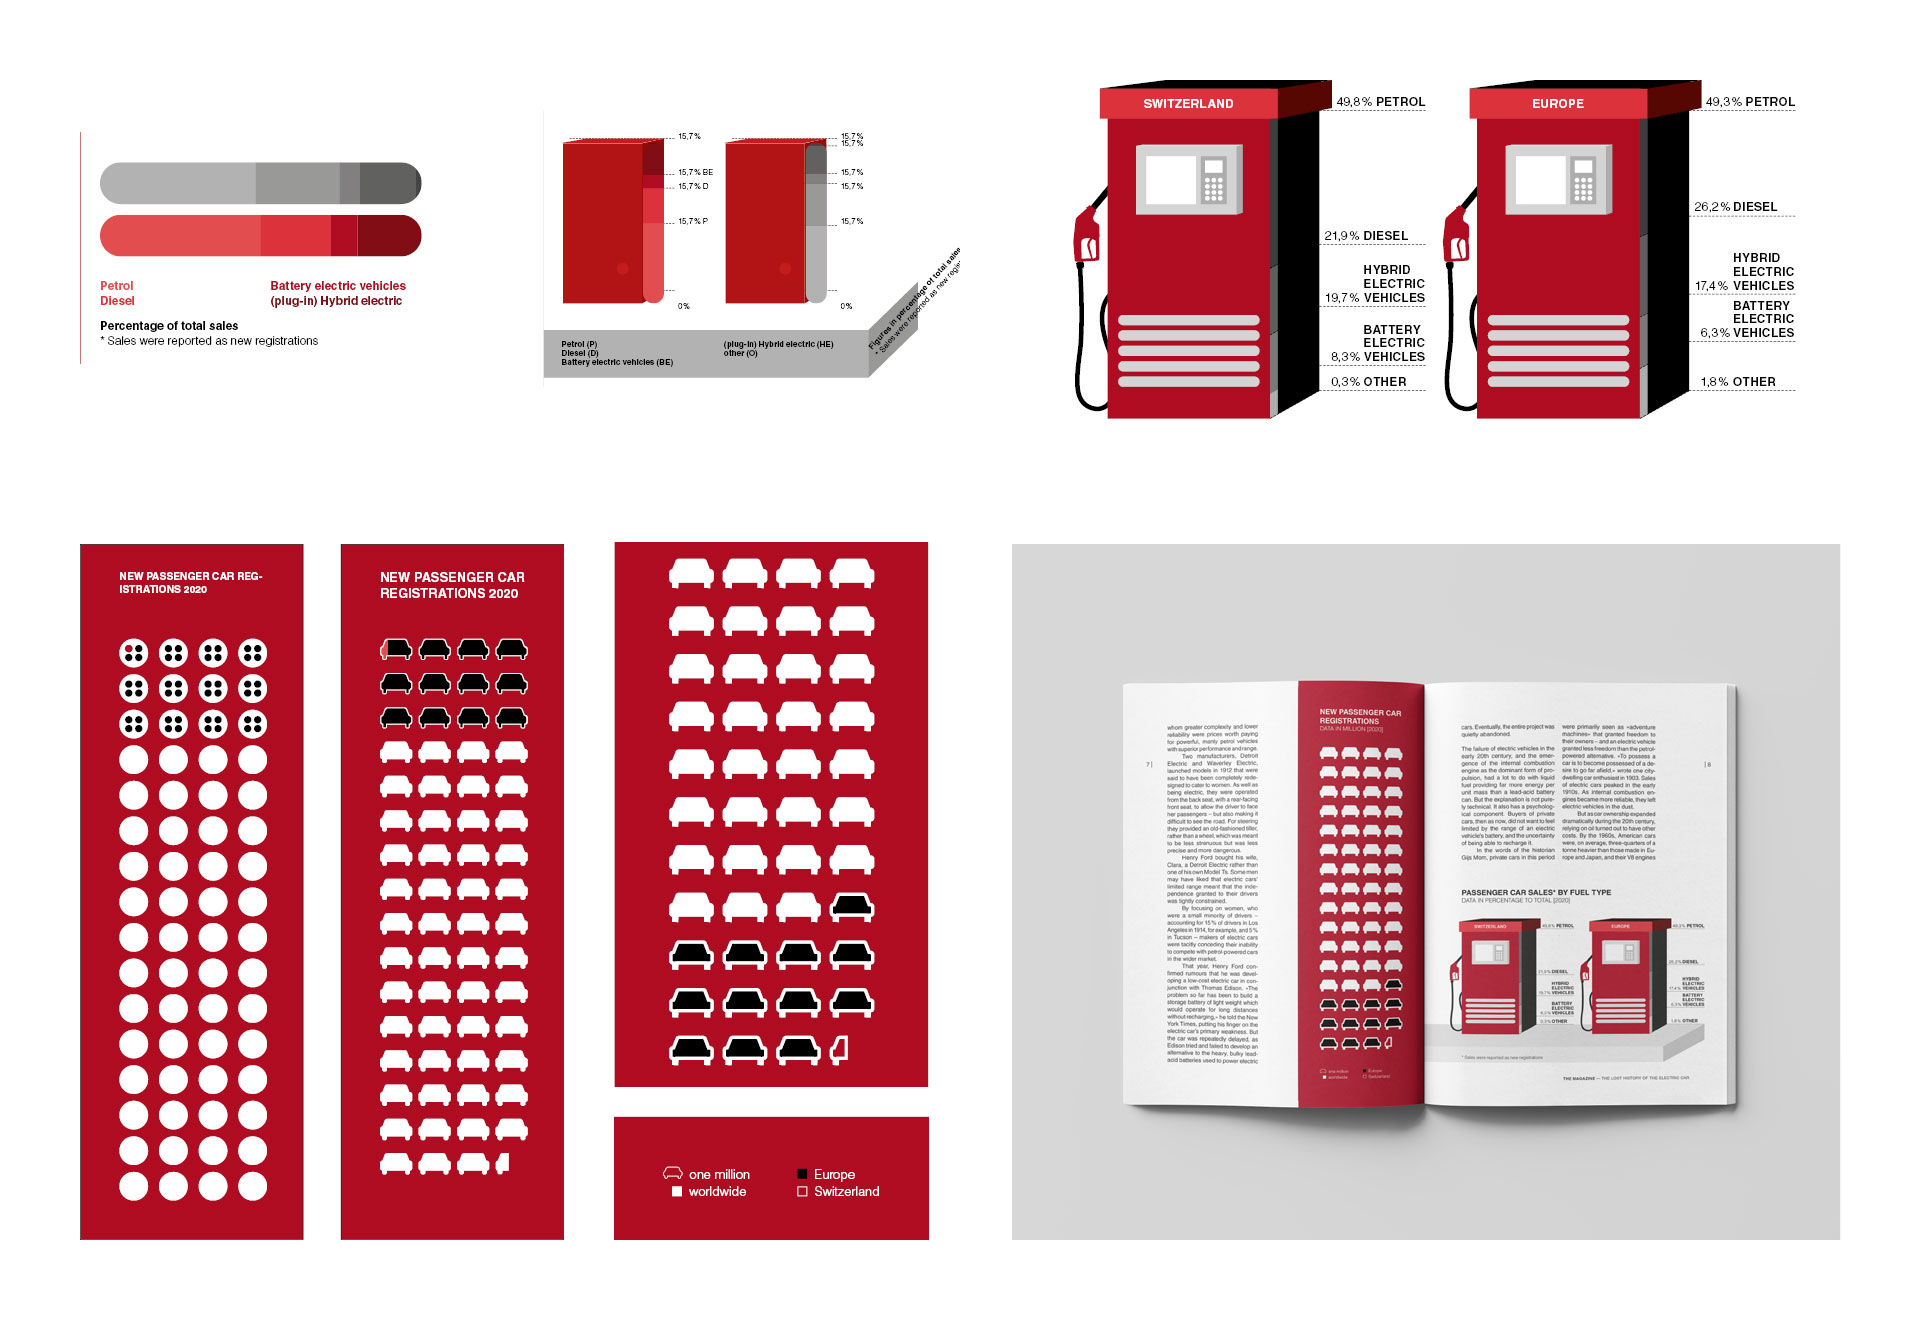
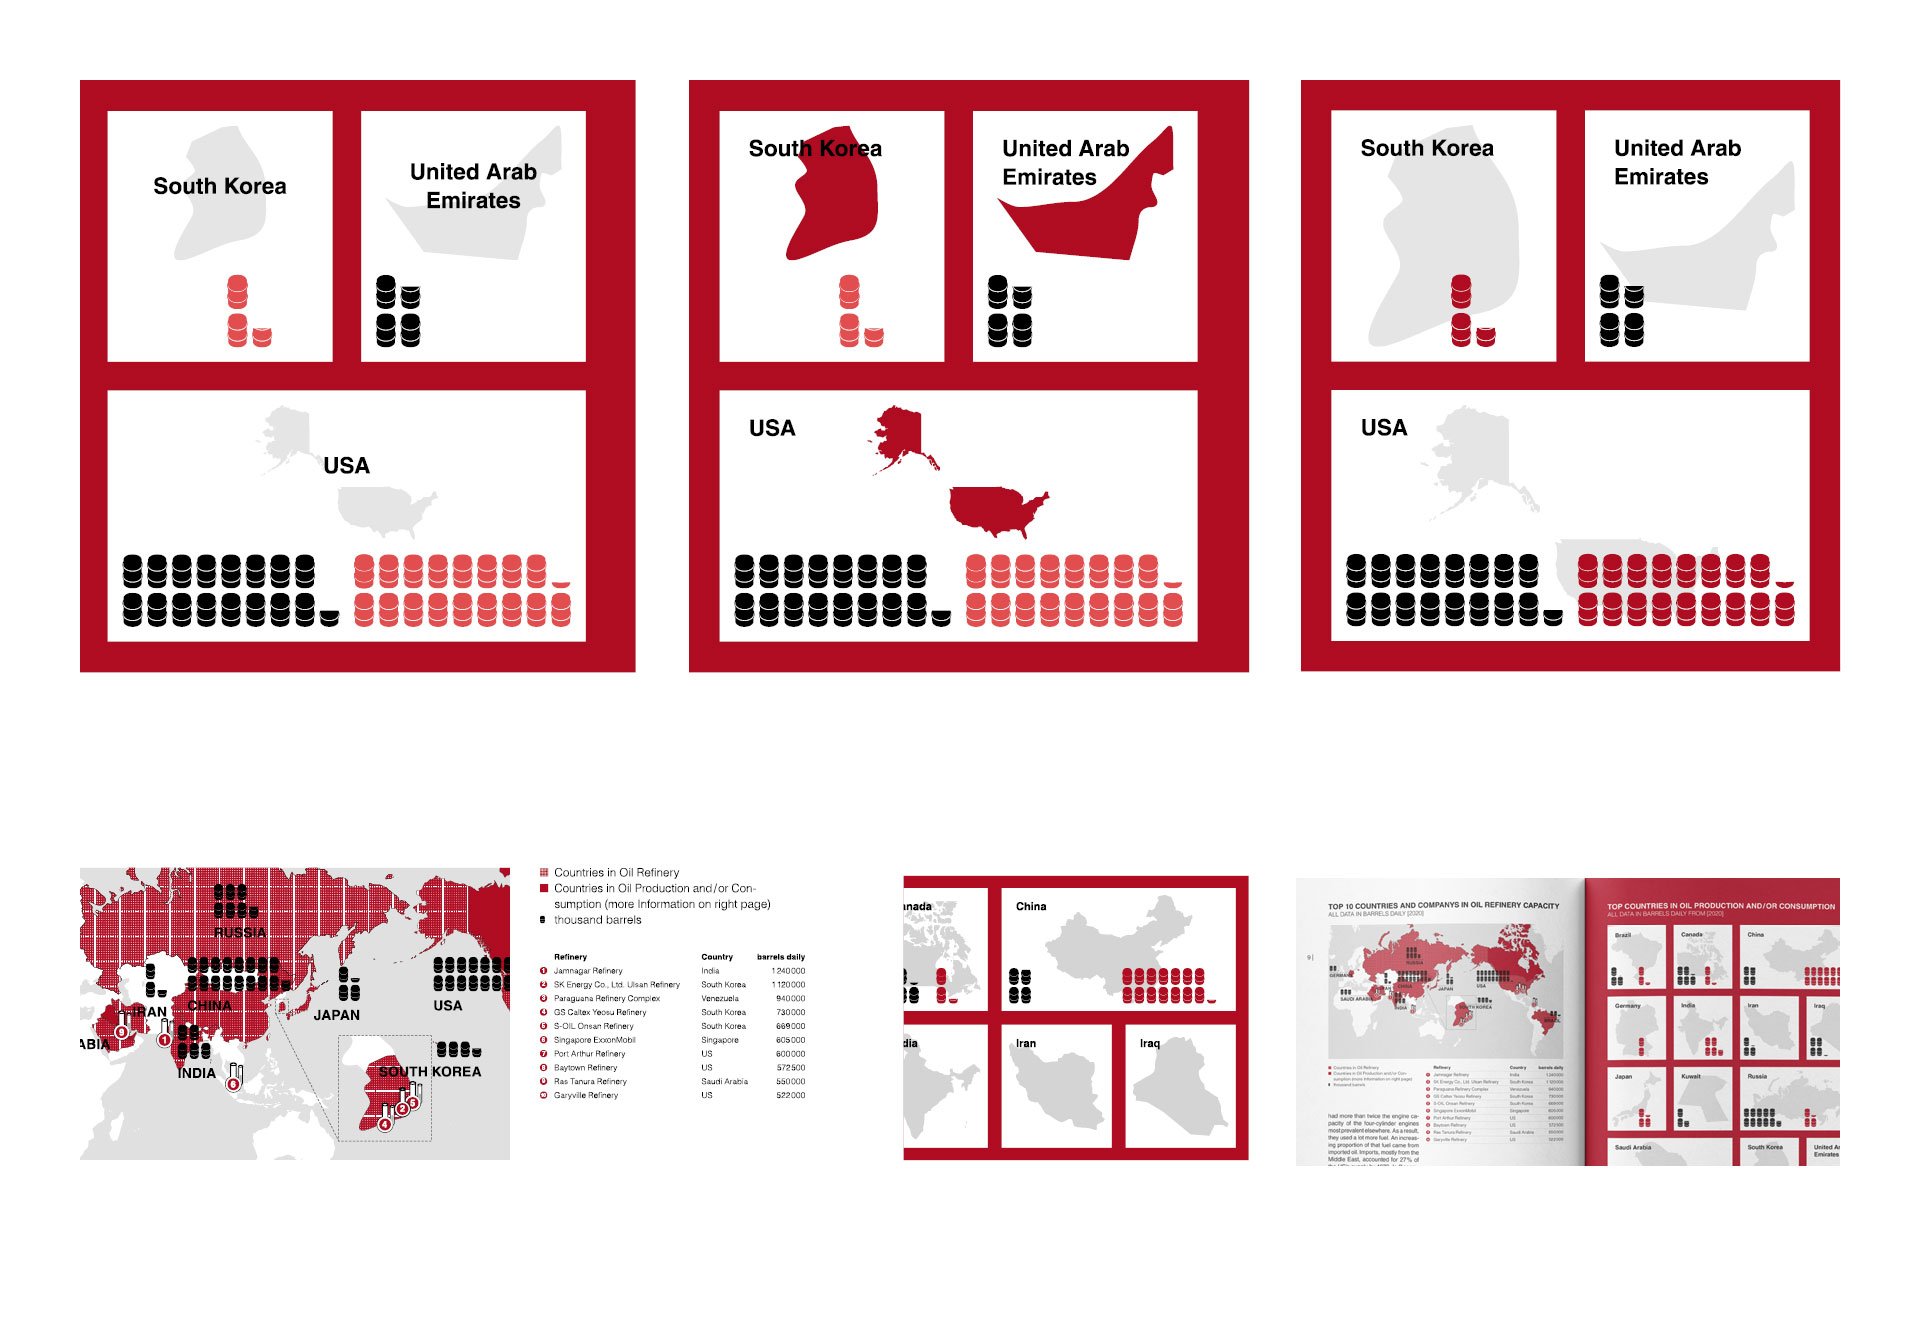
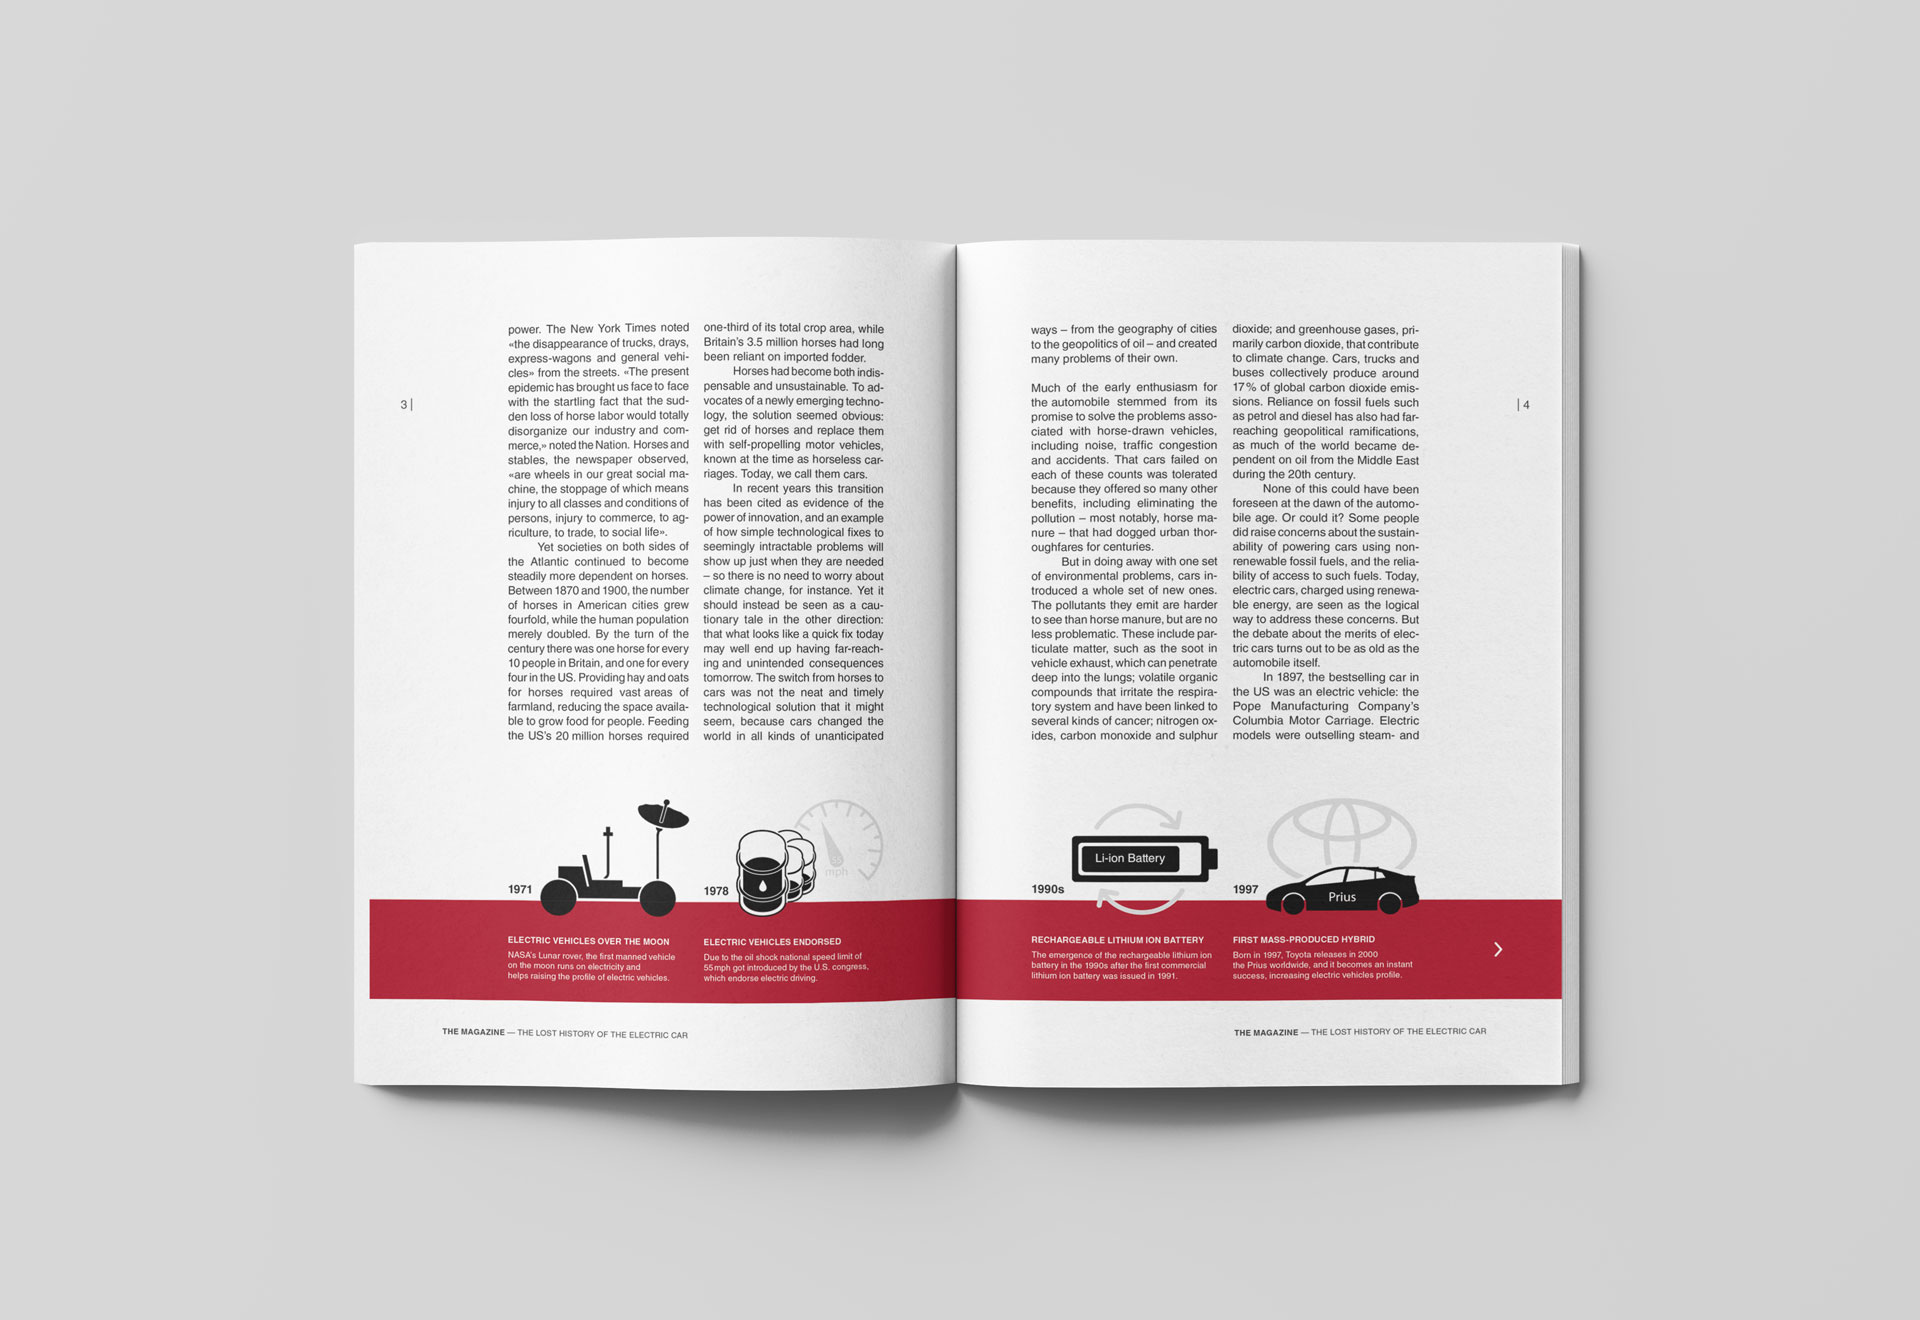
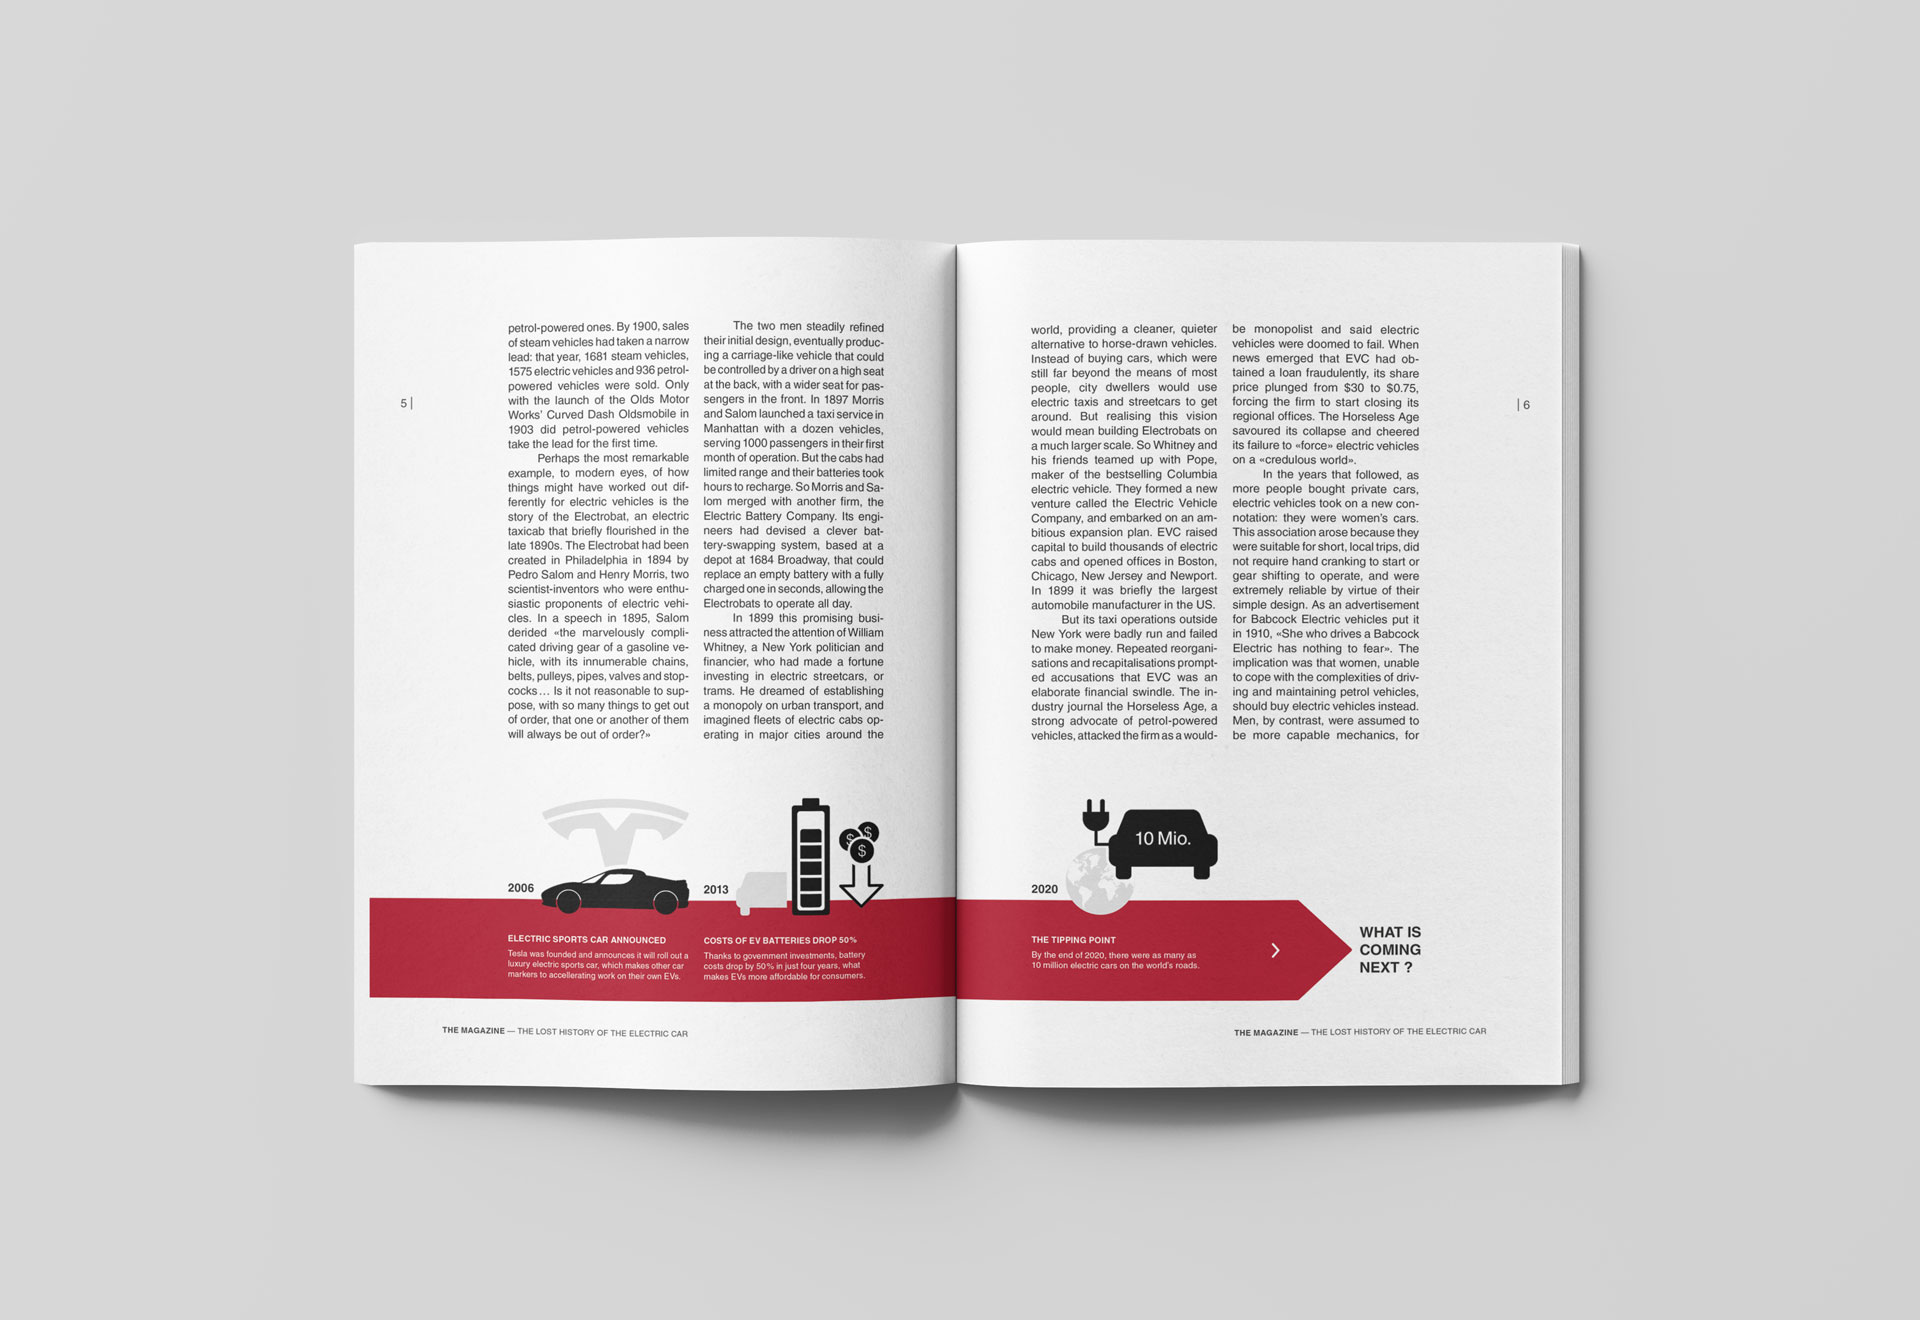
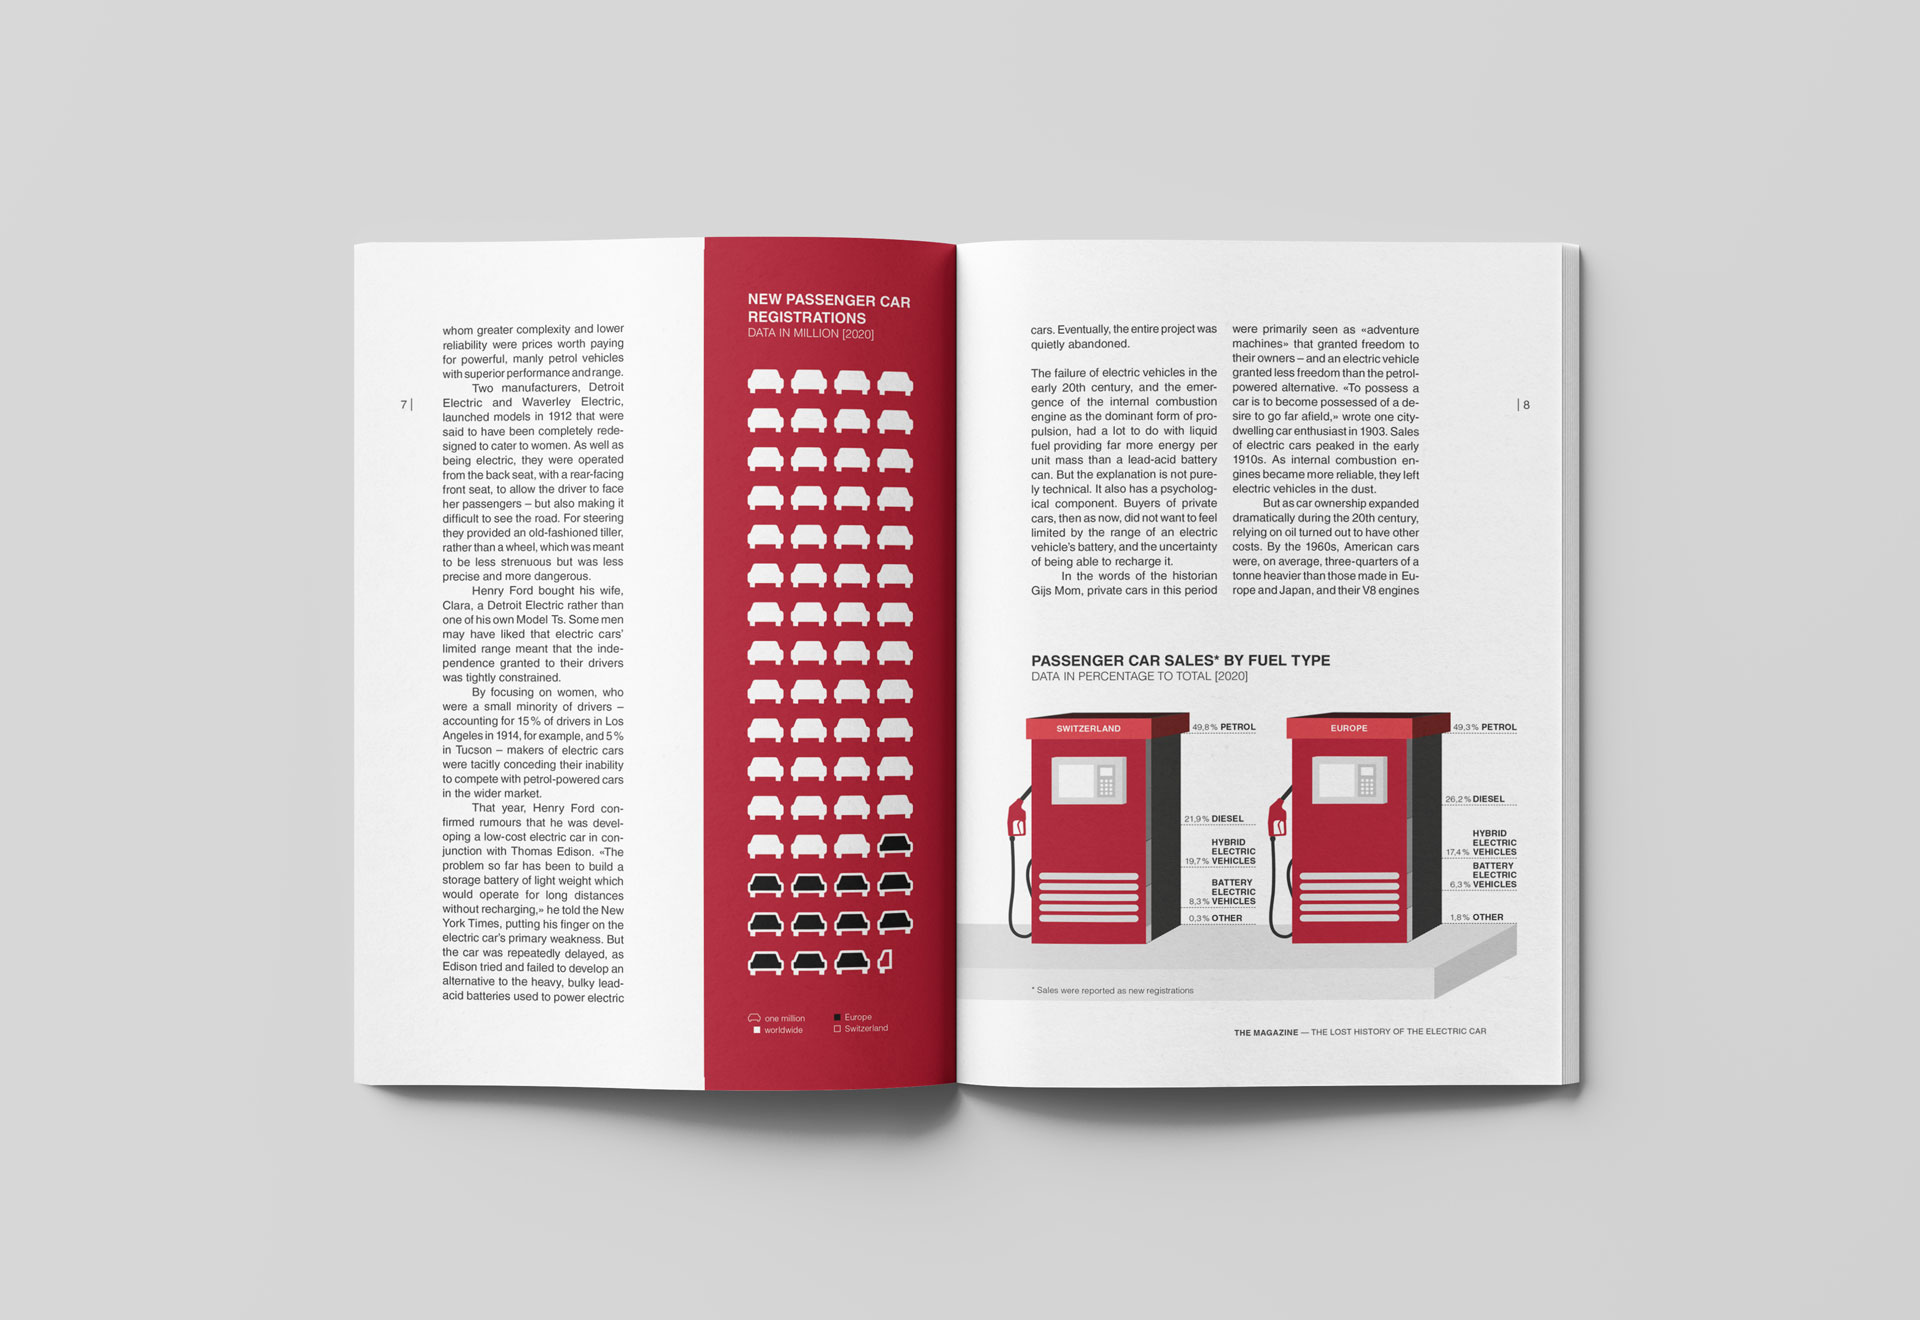
For a given newspaper article, I had to consider what kind of information and data would be helpful or add context and dimension to the article. The goal of the given task was to create comprehensive and coherent information Graphics. All while challenging myself to come up with novel ways to visualize and present the data in a way that is both engaging and clear. All while considering the following: scale, focal point, perspective, complexity, colour, form and relation of the objects and what story am I telling. The biggest challenge was the research for usable data. A lot of basic data can be easily found online, however thorough information that cover all the needs require a lot of research. Another challenge came up later when trying to display the worldwide production of oil, cobalt and lithium which showed significant differences in quantity. After reading the article I did a quick search online to get a feeling of what information I can gather online. Then coming up with ideas of what data could be of interest and ways how to visualize them was rather easy. As always some first sketches where made which helped a great deal when researching for data. first sketches It was then time to conduct some study. Since the data is the foundation of the information graphics it was from the utmost importance to do in-depth research to find useful information. According to my findings I altered the sketches so they would fit the specific data. While it was simple to come up with some visualizations, the right display of information of others was tricky. Especially since the Illustrations should not just be simple diagrams. The sketches helped build the foundation of the illustrations, but then it was a lot of playing around with the different dimensions in Illustrator and InDesign trying to display the data as comprehensive and detailed as possible. Creation process of the information graphics The following Mockups show my final Work Data visualization is the result of a thorough and deliberative thought process. Creating information visuals that should challenge the viewers’ perception of the content entails a significant degree of responsibility.// brief
// goals
// challenges
// process
![]()
project process 02
project process 03
project process 04
![]()
final editorial design mockup 01

final editorial design mockup 02
final editorial design mockup 03
final editorial design mockup 04
final editorial design mockup 05
final editorial design mockup 06
final editorial design mockup 07
// reflections